The GOP’s Economic Problem
November 10, 2015
Tonight twelve of the GOP’s candidates for president head to Milwaukee for a Fox Business Network debate to try to convince voters they should be put in charge of the most powerful economy on earth while telling us how awful it is. Unfortunately for them, they face a strong headwind: the facts. Economic indicators clearly show that Democrats have done a far better job of managing the economy, expanding opportunities for the middle class, reducing the deficit, and promoting job growth than their Republican counterparts in the White House. In just the past week we found out that:
- The economy added 271,000 jobs this past month, 268,000 of those in the private sector, the highest rate this year and a pace that marks the strongest three years of job creation since the year 2000.
- That translates into 13.5 million jobs over 68 straight months of private-sector job growth, which is not only the longest streak on record but a huge turnaround from the 800,000 jobs that were being lost per month when George W. Bush left office.
- Consistent with that growth, the unemployment rate dropped to 5.0 percent in October, while labor force participation remained steady and average hourly earnings rose, a trend we’ve seen over the past year in which average hourly earnings have risen at the fastest pace since 2009.
Of course the naysayers in the Republican field of candidates are dismissive of unemployment numbers and wage growth. They like to point to underemployment, for example. And yet there too the underemployment rate declined to its lowest level since May 2008. Other indicators are also moving in the right direction:
- Exports have risen while imports have fallen, with the total exports of goods and services increasing by $3.0 billion, which narrowed the trade deficit.
- There has been an expansion in the non-manufacturing sector, as shown by the Institute of Supply Management (ISM) Non-Manufacturing Index (NMI), the 69th consecutive month that the NMI has shown an expansion in this area.
Because the Republican candidates are coming to the Midwest for this debate, it’s also worth noting that it was a Democratic president who invested in rescuing the auto industry. There too the indicators are good for the Democrats, and pose a problem for Republicans:
- Sales of light motor vehicles in October — at 18.1 million units for the annual rate — matched the highest monthly pace since 2005.
Yet every time this crowd talks about the economy, you would think that the financial collapse of 2008 was the good old days we should want a Republican to return us to. It’s no surprise then, that at their last economy-focused event, the GOP’s standard bearers couldn’t answer the questions they were posed and chose to blame media bias. Some of the “unfair” questions they got, after all, would have required them to explain themselves. For example:
- Do you oppose that budget deal because it doesn’t cut certain programs enough?
- Apart from your tax plan, are there specific steps you would require from corporate America to try and reduce the income inequality?
- Should the Federal Government play a larger role in helping to set up retirement plans for these workers?
- [W]hy would you tax labor at a higher rate than income from investments?
- Should the government be involved in controlling some of these price increases [from pharmaceutical companies]?
So what were the Republican candidates hiding from?
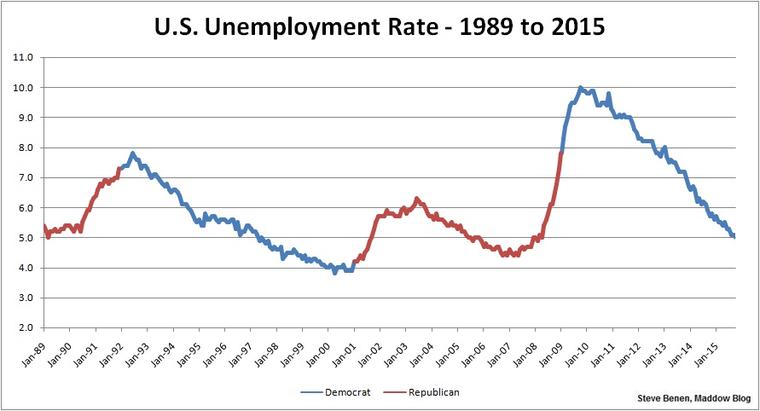 Well it turns out the policies that the Republican candidates are pushing are the same policies that were in place heading into the economic turmoil that left our country at the brink of a great depression and that during the last two Republican Administrations have preceded high unemployment. As Steve Benen reported for MSNBC, Republican presidents leave unemployment on the rise, Democrats lower it. The tax plans we’ve seen from Republican presidential contenders would give massive tax cuts to the wealthiest of the wealthy, explode the deficit, and they would shift the burden of balancing the budget onto middle-class and working families. Here’s what Marco Rubio, John Kasich, Jeb Bush, and Donald Trump have proposed so you can see for yourself:
- Marco Rubio’s tax plan means the super wealthy like Mitt Romney would pay no taxes and a Bloomberg analysis showed it would result in a $6 trillion reduction in federal revenue.
- Jeb Bush’s tax plan is like his brother’s, but worse– it would give himself an estimated $800,000 tax break annually and add as much as $3.4 trillion to the deficit.
- Trump’s tax plan would cost $12 trillion over the next decade, while giving more to the wealthy like himself.
- John Kasich’s tax plan would cut the top tax rate by over 11%, slash capital gains taxes, and eliminate the tax on estates.
Of course they’ll claim to have insight into all kinds of economic indicators to justify their pessimism on the economy. They’ll tell you the sky is falling. They’ll say they can make America great again. Well, they need to be held accountable.
We’ve compiled some of the leading indicators in several areas including jobs, GDP, housing, energy, health care, and of course deficits to help with that. If there is going to be a serious debate on the economy, then the real facts should be weighed against the rhetoric. The guide below summarizes what Democratic policies have meant over the last seven years, and they show exactly what’s at stake. Here’s to hoping the candidates get some tough questions tonight and aren’t allowed to just blame the moderators for not having any answers. Our economy depends on it.
Jobs
Full-time employment accounting for the rise in employment since early 2010. The economy has added over 11 million full-time jobs since February 2010, with part-time employment falling over this period. While about three-quarters of part-time workers do so for family, health, and other reasons, the fraction of the labor force working part-time for economic reasons declined in October. This shift helped to drive the underemployment rate, a favorite talking point of the GOP, to its lowest level since May 2008. Sorry guys.
80,000 manufacturing jobs over 12 months and 864,000 over the past 68 months. Over the past twelve months, manufacturing has added 80,000 jobs. Manufacturing job growth during the recovery has been substantially faster than during the previous two expansions. Since Chrysler and GM emerged from bankruptcy in mid-2009, the auto industry (including manufacturing and retail) has added 631,900 jobs, the industry’s strongest growth on record.
The construction sector has added 233,000 jobs over the last year. With continued recovery in housing, the unemployment rate for construction workers is at 7.5 percent, having fallen below its pre-recession average (based on a twelve-month moving average of not seasonally adjusted data).
Gross Domestic Product
Overall, GDP has risen 2.0 percent over the past four quarters, with Real GDP rising at a 1.5 percent annual rate in the third quarter of 2015, according to the advance estimate from the Bureau of Economic Analysis.
State and local government spending continues to recover, and has now increased in 5 of the last 6 quarters. State and local government purchases increased 2.6 percent at an annual rate in the third quarter and have risen 1.9 percent over the past four quarters.
Inflation was mostly unchanged in the third quarter. The GDP price index, which measures the price of all goods and services produced in the United States, rose 0.9 percent over the past four quarters. The price index for personal consumption expenditures rose 0.3 percent over the same period, with the “core” components (excluding food and energy) rising 1.3 percent.
Consumer sentiment remains near its highest levels in the recovery, providing continued upside for personal consumption growth. Consumer sentiment helps to predict future changes in consumer spending, which accounts for about 70 percent of GDP, and provides a timely indicator of economic strength. Falling gas prices and improvements in employment have helped to drive rising sentiment since mid-2014.
Housing
Housing prices continue to rise. Over the past year, all major home price indexes have posted strong year-over-year gains. In all, house prices have risen between 19 and 33 percent during the recovery.
- Case-Shiller: In August 2015, house prices were 4.7 percent higher than their year-ago level.
- CoreLogic: In September 2015, house prices were 6.5 percent higher than their year-ago level.
- FHFA: In August 2015, the year-over-year increase was 5.5 percent.
- Zillow: In September 2015, house prices were 3.7 percent higher than their year-ago level.
Rising home prices are bringing millions back above water. Zillow Real Estate estimates that rising home prices have lifted more than 6.3 million households out of negative equity since the end of 2012. The national negative equity rate fell to 14.4 percent in June 2015—less than half its peak of 31.4 percent in the first quarter of 2012. Likewise, CoreLogic estimated that nearly 5.5 million households returned to positive equity since 2013.
Sales of distressed properties have declined dramatically over the past couple of years. Distressed homes – comprised of foreclosures and short sales – accounted for 7 percent of September sales.
Energy
The United States is less reliant on foreign oil than any time in nearly three decades. The United States produces more crude oil than it imports for the first time in 20 years. Monthly domestic crude oil production exceeded net imports by 2.1 million bpd in September for the twenty-fourth consecutive month, according to data from EIA.
The United States is the world’s leading producer of petroleum and natural gas, surpassing long-standing petro-states Saudi Arabia and Russia. EIA estimates U.S. crude oil production will average 9.3 million bpd in 2015, up from 8.7 million bpd in 2014 and 74 percent higher than 2008 production. Early estimates show U.S. crude oil production averaged 9.0 million bpd in September, down slightly in recent months due to low prices but still near multi-decade highs.
The United States has vastly increased the amount of energy we harness from the wind and sun. Since 2008, electricity production from wind energy has more than tripled, and solar generation has increased twenty-five fold.
Petroleum consumption from gasoline has fallen significantly as fuel efficiency standards continue to rise. New fuel economy standards will nearly double light-duty vehicle fuel economy between 2010 and 2025, increasing standards to the equivalent of 54.5 mpg for cars and light-duty trucks by Model Year 2025. Standards for medium- and heavy-duty vehicles will also substantially raise fuel economy through 2027, cutting tractor trailer fuel use by 24 percent. That will save consumers more than $1.7 trillion at the gas pump and reduce U.S. oil consumption by 12 billion barrels over the lifetimes of vehicles sold through 2025.
Health Care
Health care prices have risen at the lowest rate in 50 years since the Affordable Care Act became law. Over the 66 months of data since the ACA became law, health care prices have risen at an average annual rate of just 1.6 percent, as measured using price data from the Bureau of Economic Analysis, slower than any prior 66-month period since data began in 1959. Health care prices have risen at an even slower 1.0 percent pace over the last 12 months.
Premiums for employer-sponsored insurance grew just 4.2 percent in 2015, and the last four years have recorded four of the five slowest growth rates on record back to 1999. The Kaiser Family Foundation’s annual survey found that the average premium for employer-sponsored family coverage rose just 4.2 percent in 2014, far below the 7.9 percent average rate seen from 2000 through 2010. Had premium growth since 2010 matched the average rate over the preceding decade, the average premium for family coverage would have been nearly $2,600 higher in 2015.
Medicare spending per beneficiary will rise just 1 percent in nominal terms in 2015, according to projections from the Centers for Medicare and Medicaid Services. This would make 2015 the sixth consecutive year in which per-enrollee Medicare spending was similar to or below economy-wide inflation. From 2000 to 2010, per-enrollee Medicare spending exceeded overall inflation by an average of 3.6 percent per year, even after adjusting for the introduction of Medicare Part D.
Since August 2010, the Congressional Budget Office has reduced its projections of Medicare and Medicaid spending in 2020 by $175 billion. This decline represents a 13 percent reduction in projected spending and primarily reflects the recent slow growth in health care spending.
Falling Deficits
Under President Obama, the deficit has fallen by about three fourths since 2009, measured as a share of the economy. The federal deficit in fiscal year 2015 was 2.5 percent of GDP, the lowest level since 2007 and about one quarter of the 9.8 percent of GDP deficit recorded in 2009. The 2015 deficit as a share of GDP was well below the average over the last 40 years. This progress reflects both a stronger economy and the deficit reduction the President has signed into law.
The President's policies are contributing to the most rapid deficit reduction since the end of World War II. The last time deficits fell at a faster rate as a share of the economy over a comparable period of time was during the post-war demobilization from 1945 to 1951.